

Opening the world of hokkaido scallop through data can transform how you source, price, and partner with suppliers. The hokkaido scallop market sits at the intersection of traditional fisheries and modern market analytics, where seasonal variation, export dynamics, and sustainability credentials shape what ends up on menus and in retail shelves. In markets like Japan, where Hokkaido remains a dominant hub for scallop production, data-driven decision-making helps buyers, suppliers, and processors navigate volatility, identify value-added opportunities, and reduce risk. For Miss A's Handpick Fine Food, this guide emphasizes neutrality and evidence, offering practical steps you can implement to understand both the technology that underpins the market and the macro trends that move prices, demand, and supply.
By the end of this guide, you’ll have a clear, actionable plan to assess hokkaido scallop opportunities using reliable data, step-by-step instructions you can execute within a few days, and a framework for ongoing monitoring that aligns with a neutral, data-driven editorial stance. Expect a mix of market intelligence, technology considerations, and procurement workflows designed to help you make informed choices about hokkaido scallop products in a way that scales with your business. The tasks outlined here are estimate-guided and implementation-oriented, with timeframes and effort levels clearly spelled out so you can gauge your next steps with confidence.
What you’ll learn will help you answer questions like: Where do hokkaido scallops come from in the current season, and how much is being harvested? How have export markets and trade tensions affected availability and pricing? What technology-enabled practices (traceability, forecasting, sustainable sourcing) can reduce risk and improve quality for your customers? This guide is designed for procurement professionals, product developers, and market analysts who need practical, data-backed guidance rather than opinion alone. Expect to invest roughly 60–90 minutes to read through, plus additional time to implement the steps in your own organization.
Prerequisites & Setup
Required Tools
- A lightweight data toolkit: spreadsheet software (Excel or Google Sheets) plus a simple BI or dashboard tool (e.g., Google Data Studio or a lightweight Tableau Public workflow). This lets you track production, price, and export signals for hokkaido scallop over time.
- Access to reputable data sources: annual or seasonal production figures for Hokkaido scallops, pricing data, and export/import information from trusted trade or fisheries sources.
- A materials-ready workspace: a shared folder or project notebook where you can collect sources, notes, and data extracts, plus a basic data dictionary to maintain consistency.
(Visuals recommended after this section: a simple data-tracking template sketch and a data-source checklist. See accompanying visuals placeholder below.)
Screenshots/Visuals:
- Visual placeholder: Data-tracking template for hokkaido scallop markets (image placeholder)
- Visual placeholder: Data-source checklist for seasonal scallop analytics (image placeholder)
Foundational Knowledge
- Basic market analysis concepts: seasonality, supply chain risk, and price volatility.
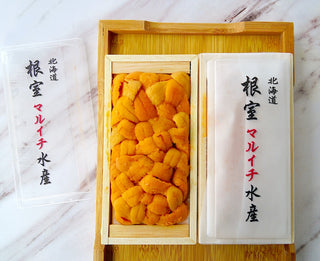
- Quick primer on scallop biology and regional production patterns in Hokkaido, including the Okhotsk coast, Funka Bay, and Saroma Lake, to contextualize the data you’ll gather. Reliable sources describe the primary production areas and the methods used in Hokkaido scallop farming, which informs data interpretation. (boj.japantimes.co.jp)
- An understanding of sustainability credentials, such as certification status, which can influence buyer preference and pricing. MSC certification has historically been a marker for sustainable fisheries. (savingseafood.org)
Resources & Accounts
- Bookmark major producer associations and brands that frequently publish market data and sustainability updates, such as the Hokkaido Federation of Fisheries Cooperative Associations (Dogyoren) and Gyoren Hokko. These organizations are central to understanding current production and processing practices. (boj.japantimes.co.jp)
- Set up alerts or weekly digests from credible seafood trade media and government-style industry analyses to stay current on seasonal shifts, export trends, and policy developments. For example, coverage around export dynamics and regulatory changes in Japan’s seafood sector has been active in recent years. (apnews.com)
Time and Difficulty
- Time to complete this setup: 1–2 hours to assemble sources, define your data dictionary, and build a basic dashboard; additional time to automate data ingestion and refine your models as you scale. Expect 1–2 days to run through the Step-by-Step Instructions thoroughly and to populate your initial insights. The overall process is data-driven but designed to stay practical and actionable for teams of modest size. (tridge.com)
Get Started with Hokkaaido Scallop Insights Leverage data-driven market signals to optimize sourcing and pricing. See It in Action →
Section 1: Prerequisites & Setup (Prerequisites & Setup)
This section lays the groundwork for a rigorous, data-driven approach to hokkaido scallop opportunities. The aim is to ensure you have the right data, tools, and context before you begin detailed analysis or procurement decisions.
Data Sources & Validation
- Identify the key data sources you will rely on for hokkaido scallop market signals. Potential sources include production season totals by region (Okhotsk, Funka Bay, Saroma Lake), seasonal harvest volumes, and export data. Notably, Hokkaaido’s scallop production has historically been among the highest in Japan, with Okhotsk coast playing a central role in annual harvests; this understanding helps frame the data you collect. (boj.japantimes.co.jp)
- Confirm data validity by triangulating multiple sources. For example, a 2024 season production figure reported in industry coverage can be cross-checked with trade-news outlets or government-research summaries. In recent coverage, seasonal totals around the 300,000-ton mark have been common in Okhotsk/Hokkaido, underscoring the importance of cross-source validation. (tridge.com)
Data Governance
- Create a simple data dictionary that defines what you measure (e.g., “seasonal production by region,” “landing tonnes,” “average price per kg,” “export volume by destination”). This dictionary will prevent misinterpretation as data sources evolve.
- Establish a versioning practice for datasets so you can reproduce findings or backfill data if new season totals become available.
- Designate a primary owner for data inputs and a secondary reviewer to ensure accuracy and consistency.
Technology & Access
- Ensure your team has access to the needed tools and accounts: spreadsheet software, a dashboard/BI tool, and any data source portals (industry associations often publish dashboards or summary reports). A lightweight BI workflow is enough to start; more advanced setups can incorporate automated data ingestion and forecasting in time.
- Prepare a simple workflow diagram that shows how data will flow from source to dashboard to decision-makers. This helps new team members onboard quickly and maintains a consistent process.
See How It Works With Market Data Learn the data steps and governance you’ll use for hokkaido scallop analysis. Try It Now →
Section 2: Step-by-Step Instructions (Step-by-Step Instructions)
This is the core tutorial: a sequenced, practical guide to building and applying a data-driven hokkaido scallop analysis workflow. Each step includes what to do, why it matters, the expected outcome, and common pitfalls.
Step 1: Define Your Objective
- What to do: Clarify the precise procurement or product goals tied to hokkaido scallop. Are you optimizing for price stability, quality consistency, or expanding a product line (frozen adductor muscles, dried scallops, or value-added ready-to-cryo offerings)?
- Why it matters: Clear objectives prevent scope creep and keep data collection aligned with business aims. If your goal is price stability, you’ll need time-series data, seasonality signals, and supplier lead times to model risk.
- Expected outcome: A succinct objective statement (one paragraph) plus a list of required data types to answer that objective.
- Common pitfalls: Vague goals (e.g., “get better pricing”) without tie-ins to measurable metrics (price variance, service level, or defect rate).
(Visuals: a simple objective-statement board and a data-need checklist)
Step 2: Assemble Core Data Sets
- What to do: Gather the essential data streams:
- Seasonal production volumes by region in Hokkaido (Okhotsk coast, Funka Bay, Saroma Lake).
- Price signals by season and destination market (domestic and export).
- Export/destination data, including China and other markets as relevant to your supply chain.
- Certification and sustainability status for suppliers (e.g., MSC status where applicable).
- Why it matters: These data streams provide the backbone for forecasting, supplier evaluation, and risk assessment. Industry coverage and sustainability discussions show where production is concentrated and how sustainability credentials influence buyer demand. (boj.japantimes.co.jp)
- Expected outcome: A data catalog containing at least 4–6 core datasets with data owners, refresh cadence, and initial quality checks.
- Common pitfalls: Using a single data source or failing to document data provenance, which makes future audits difficult.
(Visuals: data catalog screenshot; sample data table for a single season per region)
Step 3: Clean, Normalize, and Integrate Data
- What to do: Clean data for consistency (units, region names, date formats), align seasonal periods across datasets, and merge the data into a single analytic dataset or data model.
- Why it matters: Clean, normalized data ensures your analyses and dashboards reflect reality, not data quirks. For example, harmonizing tonnes, currency, and season definitions helps avoid misinterpretation when comparing production to price or exports.
- Expected outcome: A unified dataset with clear field definitions: season, region, tonnes produced, price per kg (local currency and USD), export destination, and sustainability marker.
- Common pitfalls: File format mismatches, inconsistent region naming, or mixing fiscal years with calendar years.
(Visuals: before-and-after data cleaning example; data model diagram)
Step 4: Build a Simple, Actionable Dashboard
- What to do: Create a lightweight dashboard that tracks key signals for hokkaido scallop markets:
- Production by region over the last 5–10 seasons.
- Price per kg by region and by year-to-date or season-to-season changes.
- Export destinations and volumes, highlighting shifts in markets (e.g., any rebound in China exports afterTrade tensions).
- A sustainability status indicator for core suppliers.
- Why it matters: A dashboard provides a quick, data-backed view for decision-makers to compare suppliers, anticipate price movements, and adjust procurement plans accordingly. Industry coverage has shown how market dynamics can be influenced by regulatory actions and trade developments. (apnews.com)
- Expected outcome: A live or semi-live dashboard with 4–6 primary charts, plus a section for notes and insights.
- Common pitfalls: Overcomplicating dashboards with too many metrics; ensure you can answer key questions in 1–2 clicks.
(Visuals: sample dashboard screenshot; placeholder image showing production vs. price trends)
Step 5: Apply Time-Series Forecasting for Hokkaaido Scallop Trends
- What to do: Use basic time-series techniques to forecast near-term production and price signals. Start with simple models (seasonality-adjusted moving averages or exponential smoothing) and validate with out-of-sample data.
- Why it matters: Forecasts help you plan procurement windows, allocate budgets, and hedge against volatility. The Okhotsk region and Funka Bay have distinct seasonal patterns, so seasonality-aware models perform better than naive approaches. (boj.japantimes.co.jp)
- Expected outcome: A forecast for the next 4–6 seasons (or months, depending on cadence) with confidence intervals and scenario labels (baseline, bull market, bear market).
- Common pitfalls: Overfitting to one season, ignoring external shocks (trade policy shifts, weather events); always validate with multiple horizons.
(Visuals: forecast chart with actual vs. predicted lines)
Step 6: Derive a Procurement Strategy Based on Data
- What to do: Translate data insights into a concrete procurement plan:
- Select supplier tiers by region and certification status.
- Define lead times, minimum order quantities, and contract terms aligned with forecasted demand.
- Determine pricing bands and hedging levers (e.g., frozen vs. fresh product forms).
- Why it matters: Data-driven procurement reduces risk, enhances consistency, and supports pricing strategies that reflect market realities. Industry developments emphasize the importance of market resilience and diversified supply chains, particularly in response to import restrictions and trade disruptions. (asahi.com)
- Expected outcome: A written procurement playbook with supplier segmentation, pricing guardrails, and contingency plans for seasonal fluctuations.
- Common pitfalls: Rigid contracts that do not adapt to seasonality; missing risk-adjusted price bands.
(Visuals: procurement playbook outline; sample supplier scoring matrix)
See How the Step-by-Step Guide Translates Into Practice Follow practical, hands-on steps to implement tech-driven scallop sourcing strategies. Try It Now →
Section 3: Troubleshooting & Tips (Troubleshooting & Tips)
No guide is complete without practical remedies for the rough edges. Below are common challenges you may encounter, with practical workarounds tailored to hokkaido scallop market analysis and procurement.
Data Quality & Consistency Issues
- What to do: If you notice missing values, anomalies, or inconsistent units across datasets, implement a lightweight data-cleaning routine and establish a baseline for acceptable data quality (e.g., <5% missing data per field per season).
- Why it matters: Clean data underpins credible forecasts and procurement decisions. Inconsistent data is a primary source of misinterpretation and poor supplier choices, especially in a market as variable as hokkaido scallop.
- Pro tips: Build automated validation checks in your dashboard (range checks for volumes, currency consistency across datasets) and document any data gaps with notes for future data fill.
- Common pitfalls: Over-cleaning to remove meaningful signals; always preserve raw data alongside cleaned data for auditability.
Market Volatility and External Shocks
- What to do: Maintain scenario-based forecasting with at least a baseline, optimistic, and pessimistic scenario to account for policy shifts or macro events (e.g., export bans, currency swings, or seasonal supply variations).
- Why it matters: The seafood market is sensitive to trade actions and seasonal variability. For hokkaido scallop, export markets can influence demand and prices, and regulatory changes can disrupt supply chains. (asahi.com)
- Pro tips: Build a quick “shock” monitoring rule that flags when a major market event occurs (e.g., a sudden tariff change or a new sustainability standard) and prompts a re-run of forecasts.
- Common pitfalls: Reacting to noise rather than meaningful shifts; use a threshold-based alert system.
Supply Chain Disruptions & Sustainability Signals
- What to do: If supplier reliability or certification becomes a concern (for example, shifts in certification status or supplier capacity), re-weight supplier scores to favor those with stable sustainability credentials and diversified sourcing.
- Why it matters: Sustainability certification, like MSC status, can affect market access and consumer preference. Dogyoren and related associations emphasize sustainable practices as a strategic differentiator in the hokkaido scallop market. (savingseafood.org)
- Pro tips: Maintain a short list of backup suppliers with verifiable credentials and communicate lead-time expectations clearly to avoid stockouts during peak seasons.
- Common pitfalls: Over-reliance on a single supplier or certification without verifying ongoing compliance; keep an ongoing supplier audit process.
Operational Best Practices
- What to do: Regularly retrain forecasting models with the latest season data, and adjust procurement strategies based on actuals versus forecasts.
- Why it matters: The market is dynamic; periodic recalibration ensures your decisions remain aligned with current reality rather than stale patterns.
- Pro tips: Schedule recurring quarterly reviews to refresh datasets, validate model performance, and adjust playbooks accordingly.
- Common pitfalls: Neglecting to version-control models or ignoring backtesting results when updating forecasts.
Section 4: Next Steps (Next Steps)
Step into the next phase by expanding your capabilities and strengthening your hokkaido scallop analytics program. The following subsections outline advanced techniques and related resources to deepen your mastery.
Advanced Techniques
- Expand data sources to include supplier audits, logistics metrics, and consumer demand signals from retail or foodservice channels. A broader data mix improves forecasting robustness and supplier selection.
- Integrate sustainability risk scoring into your procurement decision framework, so supplier choices align with both price efficiency and ESG considerations. As the market has shown, sustainability credentials can influence buyer perception and market access. (boj.japantimes.co.jp)
- Develop more sophisticated models that incorporate macroeconomic indicators (currency trends, import policies) and climate-related risks (seasonal weather variability affecting catches) to refine scenarios.
Related Resources
- Dogyoren and Gyoren Hokko resources for supplier relationships and product formats (frozen, dried, and value-added scallop products). These entities play a central role in the hokkaido scallop supply chain. (boj.japantimes.co.jp)
- Market reports and trade coverage offering context on how political and regulatory developments affect Japanese seafood exports. For example, news on export resumption and past trade disruptions provides context for risk planning. (apnews.com)
Improve Your Seafood Supply Chain Today Apply advanced techniques learned to boost efficiency and sustainability. Learn More →
Implementation Plan (Concrete Actions)
- Week 1: Finalize data dictionary, consolidate 4–6 core datasets, build the initial dashboard with production, price, and export signals, and draft your procurement playbook.
- Week 2: Run initial forecasts, test scenario outcomes, and align supplier-scoring with sustainability credentials; identify potential backup suppliers.
- Week 3: Pilot procurement with a controlled supplier group; monitor performance against forecast and adjust rules as necessary.
Scale Your Hokkaaido Scallop Analytics Program Take the next step with a broader data ecosystem and stronger supplier collaboration. See How It Works →
Closing
A data-driven approach to hokkaido scallop markets brings clarity to a complex supply chain. By anchoring decisions in reputable data, you can navigate seasonality, maintain quality, and manage risk with confidence. This guide has laid out a practical path—from setting up your data foundations to executing a step-by-step forecasting and procurement strategy, through to troubleshooting and continuous improvement. As you implement these steps, you’ll be better positioned to respond to market shifts, capitalize on opportunities, and maintain a steady supply of high-quality hokkaido scallop products for your customers. With the right data, your sourcing becomes a disciplined, value-added function that supports both your bottom line and your commitment to quality.
In practice, the hokkaido scallop market combines traditional fisheries management with modern analytics. The region’s production has historically been a cornerstone of Japan’s seafood industry, supported by sustainable practices and strong industry organizations that have worked to ensure responsible harvesting and processing. For buyers and chefs alike, leveraging data—coupled with credible sustainability signals and transparent supply chains—creates better consistency, more predictable costs, and a stronger narrative for the products you serve. As policy environments evolve and trade dynamics shift, your data-driven framework will remain a critical asset for maintaining a resilient hokkaido scallop program.